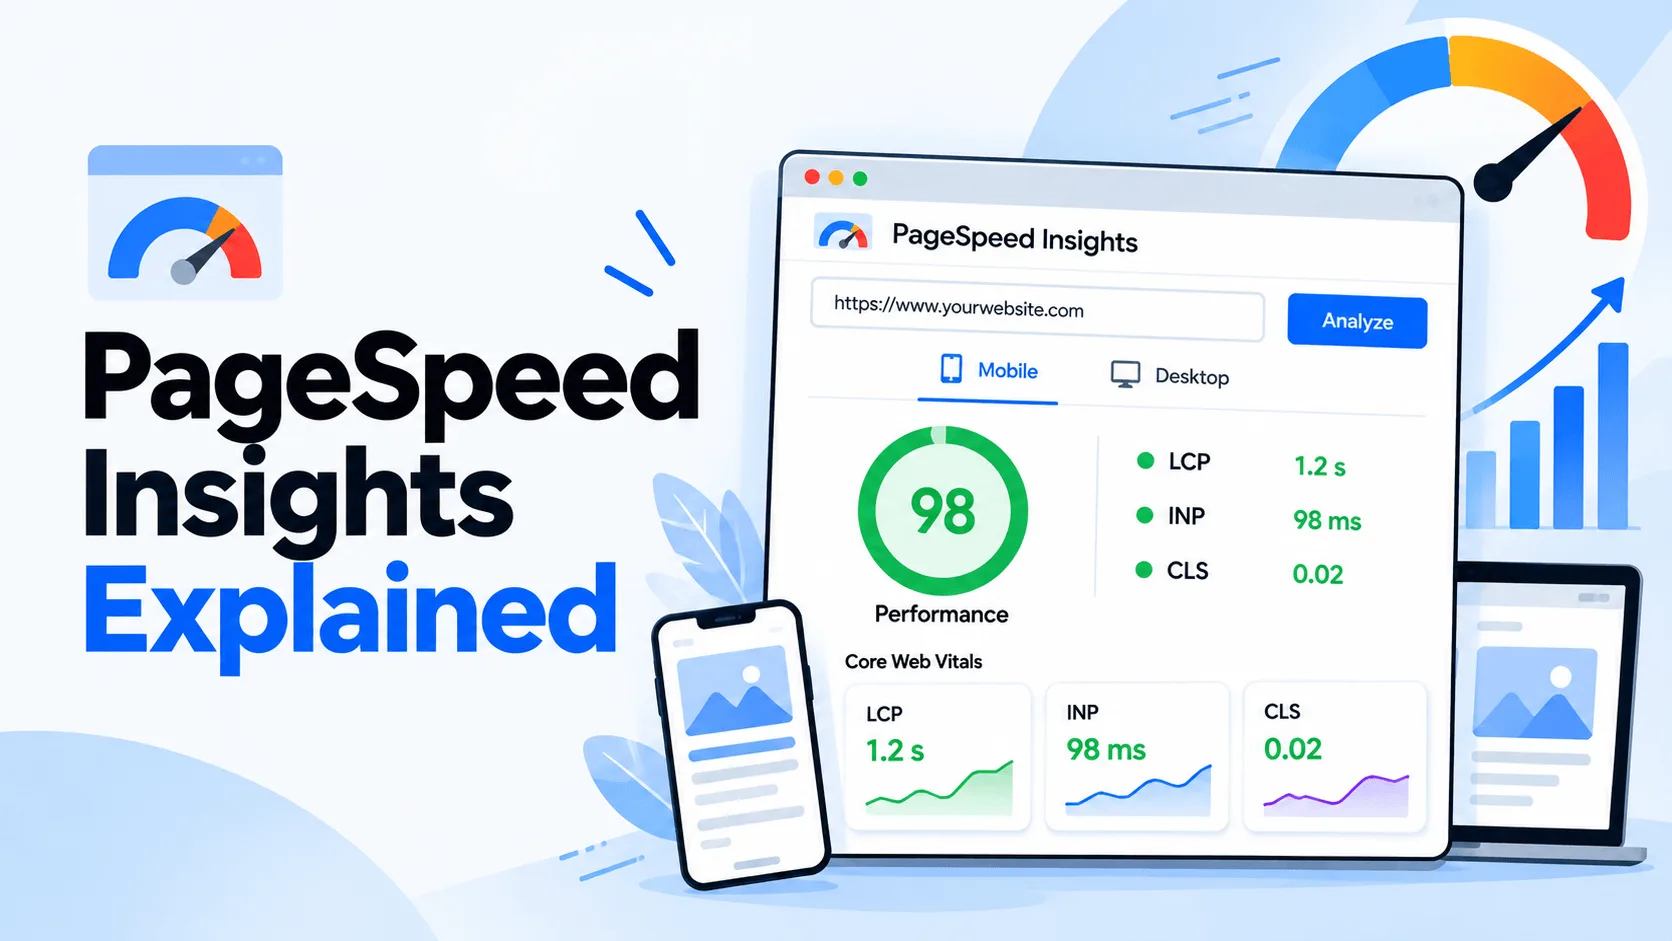
A slow or jumpy page can frustrate visitors even when PageSpeed Insights gives its controlled test a strong result. Its owner may still be unsure which technical problem is responsible. This guide shows how to run a page test, separate real-user experience from a simulation, and turn findings into a practical improvement plan. Field data means measurements of real Chrome users’ experiences with a page.
The report becomes useful when its findings are connected to what people actually experience. A large score alone cannot show whether a visitor waits too long for the main content or struggles to use a page. The goal is to identify a specific problem, make a considered change, then check whether the change helped.
Key Takeaways
- Test the exact URL, with separate mobile and desktop views.
- Field data and lab data answer different questions.
- Read individual metrics alongside the Lighthouse score.
- Prioritize user impact, then verify changes with another test.
- A useful test is one that leads to a measurable improvement for people using the page.
PageSpeed Insights Explained: What the Tool Measures
PageSpeed Insights is a free Google tool that analyzes a webpage and reports performance findings alongside other quality checks. Its report combines a performance score and audits with separate views of simulated and real-user measurements. That makes the tool useful for spotting problems, but each result needs its own interpretation.
Google PageSpeed Insights can provide Lighthouse lab data and CrUX field data. Lighthouse tests a page in a controlled setup. CrUX reflects experiences recorded from real Chrome users, when enough qualifying samples exist.
The Performance category focuses on loading and responsiveness findings. Accessibility, Best Practices, and SEO appear as separate audit categories. Those checks can reveal common issues, but their presence does not mean the page has received a complete expert review.
The performance score summarizes selected lab metrics. The Core Web Vitals assessment uses field data when it is available, so it describes a different view of website performance. A strong score does not automatically mean real visitors experience good Core Web Vitals.
Google PageSpeed Insights gives developers and site owners a shared starting point for a page review. Its insights can point to a likely problem, though they do not explain every detail of a visitor’s device, network, or browsing session. Treat its score as a diagnostic signal, not a complete description of every visitor’s experience.
How Do You Run a Test?
A test starts with the exact URL of the page whose performance needs checking. PageSpeed Insights tests a specific page, so a homepage result does not stand in for every page on a site. The test page is available at pagespeed.web.dev.
Use the same URL for later comparisons when checking whether a change improved the page. A page with a different template or content can produce different results, even when it belongs to the same website.
- Open pagespeed.web.dev in a browser.
- Enter the full URL of the page to test, including its domain and page path.
- Select Analyze and wait for the report to finish loading.
- Inspect the mobile and desktop views separately.
The mobile report and desktop report show separate test results. Check both views rather than assuming that one device view represents every visitor. Mobile performance can be affected by a different simulated device and network, while a page may behave differently on a computer.
Once the report appears, review the performance area and the audits relevant to the page’s needs. Keep a record of the tested URL and device view. Record the tested URL and device view so later comparisons use the same page and mode.
Which Metrics Appear in the Report?
The report’s three Core Web Vitals focus on loading, interaction response, and visual stability. The good field-data bands are LCP at 2.5 seconds or less, INP at 200 milliseconds or less, and CLS at 0.1 or less. Each metric describes a different part of the user experience.
LCP measures how long the largest visible content takes to load. INP measures the response to user interactions, such as a click or tap. CLS measures unexpected visual movement while content appears or shifts on the page.
CrUX reports FCP, INP, LCP, CLS, and experimental TTFB at the 75th percentile. FCP records when the first visible content appears. TTFB measures the time before the browser receives the first byte. INP replaced FID as a Core Web Vital in March 2024.
| Metric | Good | Needs improvement | Poor |
|---|---|---|---|
| LCP | 2.5 seconds or less | Above 2.5 through 4.0 seconds | Above 4.0 seconds |
| INP | 200 milliseconds or less | Above 200 through 500 milliseconds | Above 500 milliseconds |
| CLS | 0.1 or less | Above 0.1 through 0.25 | Above 0.25 |
These field-data bands show where user experience falls for each measure. The good Core Web Vitals thresholds are useful reference points, but a metric’s value also matters alongside its band. A page can have a strong loading result and still shift unexpectedly.
Use the metric that is outside its good band to identify the experience problem that needs attention.
How Do You Pass the Core Web Vitals Assessment?
A Core Web Vitals pass depends on the page’s 75th-percentile field values, not on every individual visit meeting the good thresholds. For metrics with sufficient data, the 75th-percentile LCP, INP, and CLS values must all be in their good bands.
The percentile rule means the assessment looks at the distribution of qualifying user experiences. At the 75th percentile, three quarters of measured visits are at or below that value. Some visits may be slower or less stable without changing the assessment result.
The 75th-percentile pass rule
The page or origin needs a good value at the 75th percentile for each Core Web Vital with sufficient data. The assessment uses real-user field measurements, not a requirement that every browser visit meet the same threshold.
This makes the result a view of a broad set of experiences rather than a promise about every session. Devices, browsers, and connections differ. A single unusually slow visit does not, by itself, decide whether the page passes.
What happens when INP data is limited
If there are insufficient INP samples, good 75th-percentile LCP and CLS values are enough to pass the assessment. This is an assessment rule for limited INP data, not a lower INP threshold. When INP has sufficient samples, its value remains part of the pass decision.
A pass result should not hide a metric that is close to leaving its good band. The values help show the size and direction of a problem, while the assessment gives a simpler overall status. Read the pass result together with each metric’s percentile value to see which user experience is holding the page back.
What Is the Difference Between Field and Lab Data?
Field data describes actual Chrome users’ experiences, while lab data shows how Lighthouse tests a page under a controlled setup. Field data reflects varied devices and network conditions; lab data creates a repeatable simulation that can help investigate a page. Their results can differ because they measure different conditions.
| Data type | Where it comes from | Conditions | Best use |
|---|---|---|---|
| Field | CrUX real Chrome users | Varied devices and networks | Judging real-user experience |
| Lab | Lighthouse simulation | Emulated device and network | Repeatable debugging |
Field data covers a trailing 28-day collection period, and PageSpeed Insights updates daily. It shows how users encountered a page across their own conditions, rather than during one particular lab run. That makes it useful for judging website performance in practice.
The Lighthouse mobile test simulates a mid-tier Moto G4 on a mobile network. Its desktop test uses an emulated computer with a wired connection. Those profiles give the lab data defined conditions, though they cannot reproduce every real device or network.
Lighthouse tests run in a Google data center in North America, Europe, or Asia. The test environment identifies the location used. Location and simulated conditions can affect a run, so the lab result is not a guarantee that every user sees the same speed.
Field data and lab data can complement each other without matching exactly. PageSpeed Insights combines CrUX and Lighthouse data to present both perspectives in its report. Use field results to judge real-user experience and lab findings to investigate potential causes.
What Does the Lighthouse Performance Score Mean?
Lighthouse’s Performance score summarizes lab metrics on a 0-to-100 scale, rather than reporting the Core Web Vitals field assessment. A score of 90 or above is good, 50 through 89 needs improvement, and below 50 is poor. The score helps compare lab performance, but it is not the only result worth reading.

A perfect score is not required to use the report effectively. A smaller score can still reveal which part of a page is slow, while a high score does not guarantee strong real-user field results. The number works best as a signal for further investigation.
How to read the score bands
The score bands describe how the lab metrics performed in that test. They do not measure every user’s experience or replace the Core Web Vitals assessment. A change in test conditions or page behavior can also affect a new run.
Use the score to identify movement after a meaningful change, not as a target that overrides the purpose of the page. A feature that visitors rely on may be worth keeping even when it adds work for the browser. Its delivery can still be improved.
What goes into the score
The overall score is a weighted average of metric scores. Lighthouse converts raw metric values to scores from 0 to 100 using a log-normal distribution based on HTTP Archive performance data.
Under Lighthouse 10’s documented weights, FCP and Speed Index each count for 10%, LCP and CLS each count for 25%, and TBT counts for 30%. Those weights apply to Lighthouse 10, so the calculation should be read with its version in mind.
Opportunities and Diagnostics can point to useful investigations, but they do not directly contribute to the score. A listed opportunity may still matter if it affects a user-facing metric. Check which metric is dragging the score down before deciding whether a change is worth making.
Does PageSpeed Insights Affect SEO?
A PSI score by itself does not determine a page’s position in Google Search. Google Search does not use the standalone PSI score as a direct ranking factor, while Core Web Vitals are part of page experience signals. The tool is diagnostic, not a ranking system.
That distinction matters because the score summarizes lab results, while Core Web Vitals reflect real-user experience when field data is available. A perfect score cannot guarantee a strong ranking. Search visibility also depends on the page’s relevance and usefulness to visitors.
The SEO audits in the report check common issues, but they are not a full technical SEO review. A site still needs broader attention to its pages, links, indexability, and other search needs. The audit can help flag a concern without covering every situation.
Accessibility checks also identify common issues rather than completing a full accessibility audit. A page can pass the listed checks and still create barriers for some users. More complete accessibility work requires attention to how real people use the website.
Page performance is worth improving because visitors benefit from pages that load and respond well. Search signals are only one reason to maintain a clear, usable website. Make performance changes in service of a better page experience, not as a substitute for useful content or sound SEO.
How Should You Prioritize PSI Findings?
A sensible priority is to fix the problem affecting the most users and the most important experience first. Start with mobile results and real-user impact before treating a lab warning as a problem affecting everyone. The right order helps a team use its optimization resources well.
Start with real-user impact
Mobile and desktop results are separate, so the report should be reviewed in the context of the device view. Field data describes actual Chrome users, while Lighthouse findings come from a controlled test. A lab warning can point to a possible cause, but it does not prove that every user faces that issue.
Give added attention to a finding that aligns with a weak field metric or a visible problem on an important page. A small score change may matter less than a recurring delay or interaction problem for visitors. The impact on people should guide the choice.
Separate sitewide from page-level work
Some changes can affect many pages. Caching and compression are sitewide measures that may benefit multiple templates or URLs. Other work addresses one page or template and may have little effect elsewhere.
- Resolve a widespread issue affecting many pages.
- Address the Core Web Vital that is failing.
- Fix the largest page-specific bottleneck.
- Retest changes and keep user-facing value when optimizing a feature.
A useful feature should be optimized rather than removed solely to silence an audit. Removing it may improve a score while making the page less valuable to visitors. The better choice is often to reduce its performance cost while preserving its purpose.
Priorities can shift as a website changes, especially when a shared template affects many important pages. The team should note which pages and users a proposed change serves before spending time on it. Keep a user-valued feature when its delivery can be improved without compromising what it does.
Which Common Performance Issues Should You Fix First?
The best first fix depends on whether the warning points to loading, interaction, stability, or server response. Match the issue to the metric it is most likely to affect before changing code or files. Common PSI findings include render-blocking resources, unused CSS or JavaScript, oversized images, and server response delays.

| PSI issue | Likely cause | First action | Metric most affected |
|---|---|---|---|
| Oversized or late-discovered main image | Large file or delayed discovery | Serve a properly sized, compressed image and prioritize the LCP image | LCP |
| Render-blocking or excess JavaScript | Scripts delay rendering or occupy the main thread | Defer nonessential scripts and remove unused code | INP |
| Layout shift from media without dimensions | Image or embed space is not reserved | Reserve image or embed dimensions | CLS |
| Slow HTML response | Server response takes too long | Investigate caching, server response, and CDN delivery | TTFB |
Images affect the loading experience when the main visual is too large or the browser discovers it late. Offscreen images may be lazy-loaded, but the LCP image should not be delayed. A properly sized file reduces unnecessary bytes without postponing the content visitors came to see.
JavaScript and third-party code can keep the browser busy while it processes interactions. Removing unused code or delaying nonessential scripts can reduce that work. For layout movement, reserving space prevents an image or embed from pushing nearby content aside as it loads.
TTFB measures the time before the browser receives the first byte, so a slow result can point toward an HTML response delay. Retest after each significant change to confirm that the intended metric improved without breaking page behavior.
Why Is Field Data Missing?
A missing field-data panel usually means PSI does not have enough qualifying CrUX samples for the tested URL or its origin. PSI shows URL-level field data when the page has sufficient samples, falls back to origin-level data when possible, and shows none when the origin also lacks enough samples.
URL-level and origin-level eligibility
A URL needs to be public, crawlable, and indexable for CrUX data to be available. It also needs enough distinct samples to support a representative, anonymized view of performance. A staging page or a page seen by too few qualifying users may not meet those conditions.
When URL-level samples are insufficient, PSI can display data for the page’s origin instead. Origin-level data describes the site more broadly, so it may not match the tested page’s template or content. URL and origin field-data eligibility depends on both qualifying pages and sufficient samples.
What to do without CrUX samples
Without URL-level field data, the report can still help investigate page behavior. These steps keep the distinction between simulation and real-user evidence clear:
- Run Lighthouse lab tests for diagnostic clues.
- Compare other pages on the same origin when origin data is present.
- Improve public-page eligibility and gather representative visits before relying on URL-level field data.
A lab test can show how a page behaves in its simulated environment, even when the CrUX panel is empty. Results from other pages on the same origin may offer context, but they do not prove that the tested URL behaves identically.
When field data is absent, avoid treating a single lab result as a full picture of visitors’ experience. Treat a lab result on a low-traffic page as a debugging clue, not as a substitute for real-user evidence.
How Can You Track Results Over Time?
A single lab test is a snapshot, so improvement tracking needs repeatable tests and field data over time. Keep the page and device view consistent for lab comparisons, then use field data to watch longer-term user outcomes. A record of each change makes the results easier to interpret.
- Keep a record of the URL and device view.
- Rerun a consistent lab test after a meaningful change.
- Watch field data for longer-term user outcomes.
- Use the PSI API when report collection needs automation.
The PSI API can return report data in JSON with an API key, which supports automated collection. CrUX BigQuery releases are updated monthly on the second Tuesday, and each monthly release represents a 28-day collection period. PSI’s daily update and the BigQuery monthly release are different schedules.
In September 2026, CrUX added experimental Core Web Vitals variants with soft-navigation metrics for single-page applications to its BigQuery dataset and APIs. That release reported good Core Web Vitals for 55.9% of origins without soft-navigation metrics, and 59.5% with them included.
Those variants are experimental and focus on navigation within single-page applications. Teams measuring single-page applications should check whether their reporting workflow accounts for the experimental soft-navigation metrics.
Conclusion
Useful performance work starts by measuring a real page and choosing a change that can be checked. Real-user experience and diagnostic findings answer different questions, and progress matters more than a perfect score. Both can help a team understand where a website needs attention.
A practical next step is to test one representative page and record its current findings. Choose one high-impact fix, make the change, and rerun the same test to check its effect. The next practical step is to run PSI on one important URL and record the first issue the team will address.
FAQ
Why does PageSpeed Insights show different scores on repeat tests?
PageSpeed Insights scores can change between tests because Lighthouse uses a simulated environment and page behavior or test conditions may shift. The browser may encounter different timing for resources, scripts, or page activity on a later run. For a useful comparison, test the same URL in the same device view, then focus on clear changes rather than small score movement.
Is a PageSpeed Insights score of 100 necessary?
No, a PageSpeed Insights score of 100 is not necessary. A Lighthouse Performance score of 90 or higher is in the good band, and the report can still guide improvements below that mark. Real-user experience and Core Web Vitals remain important because a high lab score alone does not show how visitors experience the page.
Can PSI test a staging website?
Yes, Lighthouse can test a staging page if the test environment can reach it. CrUX field data has stricter requirements: the URL must be public, crawlable, and indexable, with enough distinct samples for a representative view. A private staging page may therefore show lab findings without real-user field data.
Does PSI still use FID?
No, INP replaced FID as a Core Web Vital in March 2024. INP measures the response to user interactions across a page experience, rather than relying on the earlier FID measure. Reports and performance guidance should use INP as the current responsiveness metric for Core Web Vitals.
How often should a website be retested after a performance change?
Rerun a consistent lab test after each meaningful performance change. Use the same URL and device view to make the comparison useful, and watch field data for longer-term outcomes. Field data can take time to reflect changed visitor experiences, so a single immediate lab result should not stand in for that trend.
What are soft-navigation metrics?
Soft-navigation metrics measure navigation within single-page applications, where the browser may update content without a full page load. Experimental Core Web Vitals variants for soft navigation were added to CrUX BigQuery and APIs in September 2026. Teams tracking these applications can check whether their reporting includes those experimental measures.